
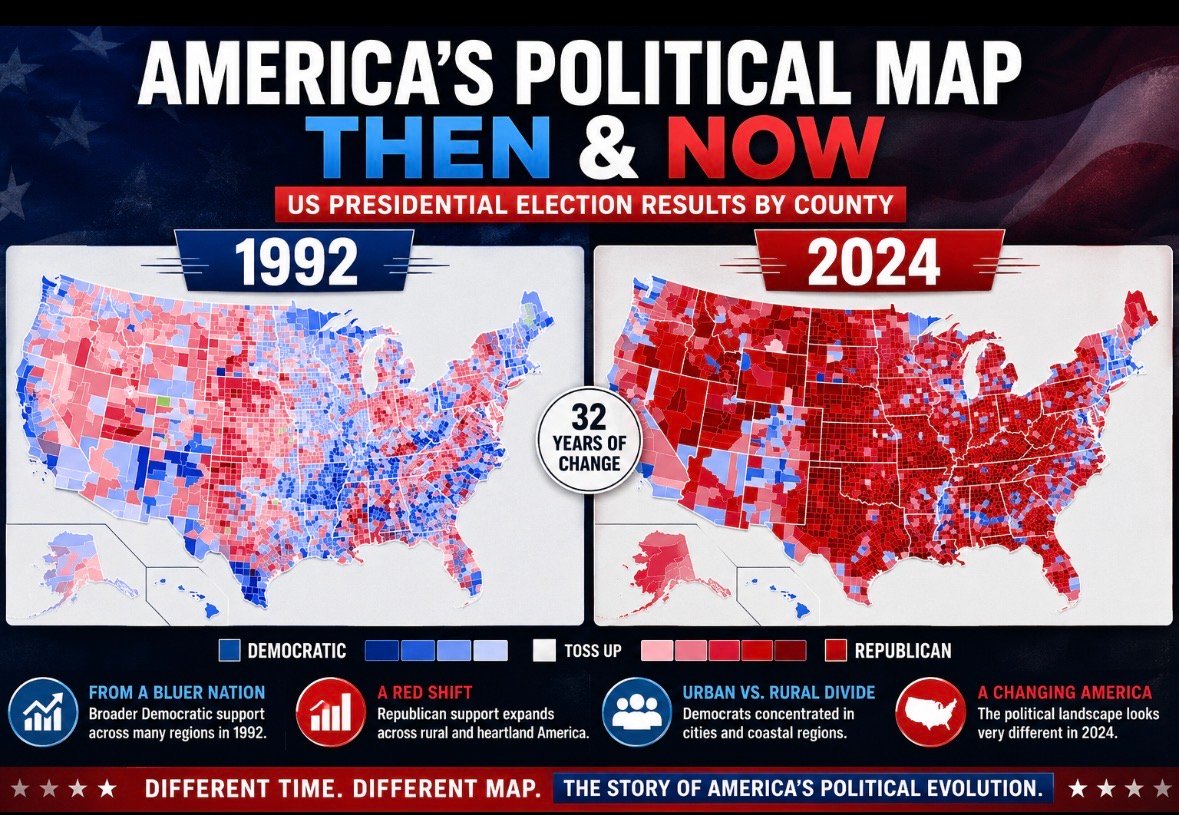
Washington: A striking comparison of U.S. presidential election results by county shows how dramatically America’s political geography has changed over the past three decades.
A county-level map comparing the 1992 and 2024 presidential elections highlights a major shift toward Republican voting across large parts of the United States.
In 1992, Democratic support was far more geographically widespread. Large portions of the South, Midwest and West contained numerous counties won by Democratic nominee Bill Clinton, alongside strong Democratic support in major urban areas.
The 2024 map looks markedly different. Republican support dominates much of the country’s interior, particularly across the Great Plains, Mountain West and many rural counties in the Midwest and South. Democratic strength is increasingly concentrated in major metropolitan areas, parts of the Northeast and West Coast, and selected urban and suburban counties.
The comparison illustrates one of the defining developments in modern American politics: the increasing urban-rural and regional polarization of the electorate.
The maps also demonstrate why looking only at state-level election results can sometimes obscure important political changes. Within individual states, counties can show sharply different voting patterns, with dense metropolitan areas often moving in a different political direction from surrounding rural communities.
The transformation is particularly notable in the South and parts of the Midwest, where many counties that supported Democratic presidential candidates in earlier decades have shifted decisively toward the Republican Party.
At the same time, Democratic candidates have consolidated support in many large population centers. This has contributed to an increasingly polarized electoral map in which geography, population density and urban-rural divides play a major role in presidential elections.
The 1992–2024 comparison therefore offers a visual snapshot of how the American political landscape has evolved—from a more geographically competitive two-party map to one in which partisan identities are much more strongly associated with particular regions and types of communities.
Source: Brilliant Maps — U.S. Presidential Election Results Map by County, 1992 vs. 2024.